Difference between revisions of "File: Carbon cycle-cute diagram.jpeg" - New World Encyclopedia
From New World Encyclopedia
(added source and category tags) |
Rick Swarts (talk | contribs) |
||
| Line 1: | Line 1: | ||
| + | This carbon cycle diagram shows the storage and yearly changes of the carbon between the atmosphere, hydrosphere and geosphere in Gigatons - or billion tons - of Carbon (GtC). Humanity adds about 5.5 billion tons of carbon dioxide per year, most of which goes directly into the atmosphere. | ||
| + | |||
[http://en.wikipedia.org/wiki/Image:Carbon_cycle-cute_diagram.jpeg source and rights] | [http://en.wikipedia.org/wiki/Image:Carbon_cycle-cute_diagram.jpeg source and rights] | ||
[[Category:Images-Physical sciences]] | [[Category:Images-Physical sciences]] | ||
| + | |||
| + | |||
| + | From http://earthobservatory.nasa.gov/Library/CarbonCycle/carbon_cycle4.html | ||
| + | |||
| + | This image was created by NASA and taken from a NASA website or publication. NASA copyright policy notes that "NASA material is not protected by copyright unless noted". | ||
Latest revision as of 22:48, 6 August 2006
This carbon cycle diagram shows the storage and yearly changes of the carbon between the atmosphere, hydrosphere and geosphere in Gigatons - or billion tons - of Carbon (GtC). Humanity adds about 5.5 billion tons of carbon dioxide per year, most of which goes directly into the atmosphere.
From http://earthobservatory.nasa.gov/Library/CarbonCycle/carbon_cycle4.html
This image was created by NASA and taken from a NASA website or publication. NASA copyright policy notes that "NASA material is not protected by copyright unless noted".
File history
Click on a date/time to view the file as it appeared at that time.
| Date/Time | Thumbnail | Dimensions | User | Comment | |
|---|---|---|---|---|---|
| current | 01:18, 15 February 2006 | 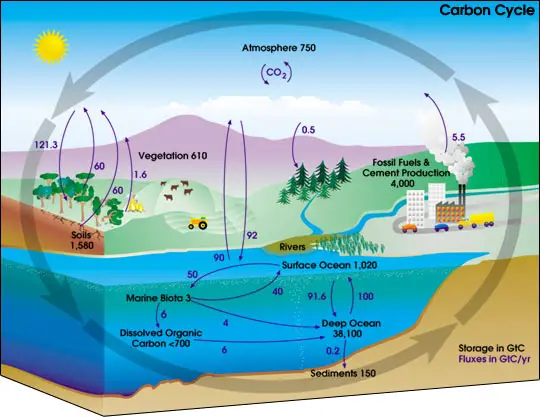 | 540 × 417 (52 KB) | Dinshaw Dadachanji (talk | contribs) | imported image from WP |
You cannot overwrite this file.
File usage
The following 6 pages use this file: