Venn diagram
Venn diagrams are illustrations used in the branch of mathematics known as set theory. They show all of the possible mathematical or logical relationships between sets (groups of things).
Origins
The Hull-born British philosopher and mathematician, John Venn (1834-1923), introduced the Venn diagram in 1881.
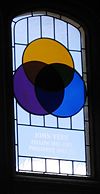
A stained glass window in Caius College, Cambridge, where Venn studied and spent most of his life, commemorates him and represents a Venn diagram.
Examples
The orange circle (set A) might represent, for example, all living creatures which are two-legged . The blue circle, (set B) might represent living creatures which can fly. The area where the blue and orange circles overlap (which is called the intersection) contains all living creatures which can fly and which have two legs — for example, parrots. (Imagine each separate type of creature as a point somewhere in the diagram.)
Humans and penguins would be in the orange circle, in the part which does not overlap with the blue circle. Mosquitos have six legs, and fly, so the point for mosquitos would be in the part of the blue circle which does not overlap with the orange one. Things which do not have two legs and cannot fly (for example, whales and rattlesnakes) would all be represented by points outside both circles. Technically, the Venn diagram above can be interpreted as "the relationships of set A and set B which may have some (but not all) elements in common".
The combined area of sets A and B is called the union of sets A and B. The union in this case contains all things which either have two legs, or which fly, or both.
The area in both A and B, where the two sets overlap, is defined as A∩B, that is A intersected with B. The intersection of the two sets is not empty, because the circles overlap, i.e. there are creatures that are in both the orange and blue circles.
Sometimes a rectangle called the Universal set is drawn around the Venn diagram to show the space of all possible things. As mentioned above, a whale would be represented by a point that is not in the union, but is in the Universe (of living creatures, or of all things, depending on how one chose to define the Universe for a particular diagram).
Extensions to higher numbers of sets
Venn diagrams typically have three sets. Venn was keen to find symmetrical figures…elegant in themselves representing higher numbers of sets and he devised a four set diagram using ellipses. He also gave a construction for Venn diagrams with any number of curves, where each successive curve is interleaved with previous curves, starting with the 3-circle diagram.
Simple Symmetric Venn Diagrams
D. W. Henderson showed in 1963 that the existence of an n-Venn diagram with n-fold rotational symmetry implied that n was prime.[1] In 2003, work by Griggs, Killian, and Savage showed that this condition is also sufficient.[2]
Edwards' Venn diagrams
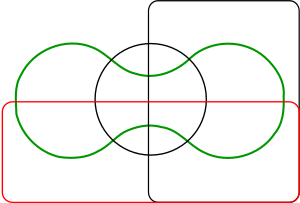
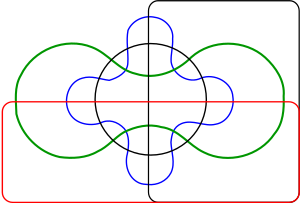
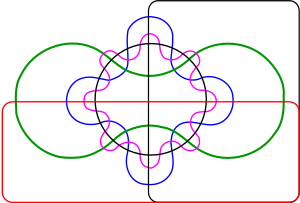
A. W. F. Edwards gave a construction to higher numbers of sets that features some symmetries. His construction is achieved by projecting the Venn diagram onto a sphere. Three sets can be easily represented by taking three hemispheres at right angles (x≥0, y≥0 and z≥0). A fourth set can be represented by taking a curve similar to the seam on a tennis ball which winds up and down around the equator. The resulting sets can then be projected back to the plane to give cogwheel diagrams with increasing numbers of teeth. These diagrams were devised while designing a stained-glass window in memoriam to Venn.
Other diagrams
Edwards' Venn diagrams are topologically equivalent to diagrams devised by Branko Grünbaum which were based around intersecting polygons with increasing numbers of sides. They are also 2-dimensional representations of hypercubes.
Smith devised similar n-set diagrams using sine curves with equations y=sin(2ix)/2i, 0≤i≤n-2.
Charles Lutwidge Dodgson (a.k.a. Lewis Carroll) devised a five set diagram.
Classroom use
Venn diagrams are often used by teachers in the classroom as a mechanism to help students compare and contrast two items: characteristics are listed in each section of the diagram, with shared characteristics listed in the overlapping section.
In Indian schools the basic Venn diagrams are taught using coins.
Notes
- ↑ D. W. Henderson, "Venn diagrams for more than four classes". American Mathematical Monthly, 70 (1963) 424–426.
- ↑ Ruskey, Frank and Carla D. Savage, and Stan Wagon (December 2006). The Search for Simple Symmetric Venn Diagrams. Notices of the AMS 53 (11): 1304-1311.
ReferencesISBN links support NWE through referral fees
- A Survey of Venn Diagrams by F. Ruskey and M. Weston, is an extensive site with much recent research and many beautiful figures.
- I. Stewart Another Fine Math You've Got Me Into 1992 ch4
- A.W.F. Edwards. Cogwheels of the Mind: the story of Venn diagrams, Johns Hopkins University Press, Baltimore and London, 2004.
- "Venn Diagram Survey: Symmetric Diagrams", The Electronic Journal of Combinatorics, June 2005).
- John Venn (1880). On the Diagrammatic and Mechanical Representation of Propositions and Reasonings. Dublin Philosophical Magazine and Journal of Science 9 (59): 1—18.
See also
- Boolean algebra
- Diagram
- Euler diagram
- Graphic organizers
- Mrs. Miniver's problem
- Spider diagram
External links
- What is a Venn diagram?, from the survey page (below).
- LogicTutorial.com - interactive Johnston diagram
- Lewis Carroll's Logic Game — Venn vs. Euler at cut-the-knot
- A Survey of Venn Diagrams
- Venn Diagrams at cut-the-knot
- Region Identification in Venn Diagrams at cut-the-knot
Tools for making Venn Diagrams
- ConceptDraw
- SmartDraw
- Microsoft PowerPoint
- Venn Diagram - Flash Template
- VennDiagrams
- Winvenn
- DrawVenn
- VennDiagram.tk
- 3 Circle Venn Diagram Applet
- Venn diagram program for the Casio calculator
- "Venny" An interactive tool to compare up to 4 lists with Venn diagrams
Credits
New World Encyclopedia writers and editors rewrote and completed the Wikipedia article in accordance with New World Encyclopedia standards. This article abides by terms of the Creative Commons CC-by-sa 3.0 License (CC-by-sa), which may be used and disseminated with proper attribution. Credit is due under the terms of this license that can reference both the New World Encyclopedia contributors and the selfless volunteer contributors of the Wikimedia Foundation. To cite this article click here for a list of acceptable citing formats.The history of earlier contributions by wikipedians is accessible to researchers here:
The history of this article since it was imported to New World Encyclopedia:
Note: Some restrictions may apply to use of individual images which are separately licensed.


