File: Processing-of-sound.svg

Original file (SVG file, nominally 1,000 × 375 pixels, file size: 15 KB)
Description
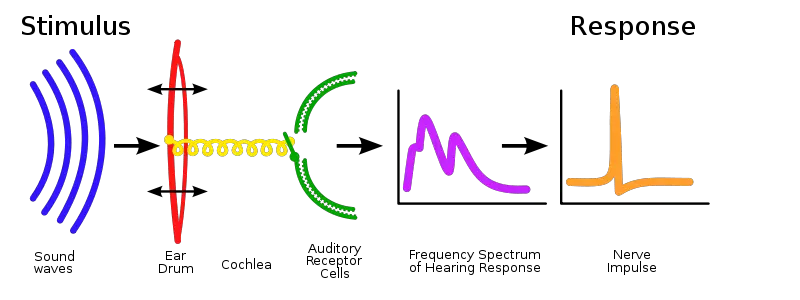
A schematic representation of hearing. (Blue: sound waves. Pink: auditory canal Red: ear drum. Yellow: cochlea. Green: auditory receptor cells. Purple: frequency spectrum of hearing response. Orange: nerve impulse Source
"Computation Provides a Virtual Recording of Auditory Signaling", Public Library of Science Biology, January 2005, Volume 3, Issue 1, e26, graphic ref. DOI: 10.1371/journal.pbio.0030026.g001. Date
January 2005 Author
Original diagram by Tim Gollisch, Andreas M. V. Herz, and Public Library of Science. Converted to SVG by Iain 03:57, 12 June 2006 (UTC) Permission
The Journal is published under a Creative Commons Attribution License. ((!)) style="background: #CCF; padding-right: 0.4em; text-align: right;" | Other versions
JPG version Image:Processing of sound.jpg
Licensing Creative Commons w/ Attribution This file is licensed under Creative Commons Attribution 2.5 License.
File history
Click on a date/time to view the file as it appeared at that time.
| Date/Time | Thumbnail | Dimensions | User | Comment | |
|---|---|---|---|---|---|
| current | 16:09, 16 June 2006 | 1,000 × 375 (15 KB) | Dinshaw Dadachanji (talk | contribs) | [http://en.wikipedia.org/wiki/Image:Processing-of-sound.svg source and rights] |
You cannot overwrite this file.
File usage
The following 2 pages use this file: