File: Phanerozoic Climate Change.png
Phanerozoic_Climate_Change.png (600 × 452 pixels, file size: 31 KB, MIME type: image/png)
Description

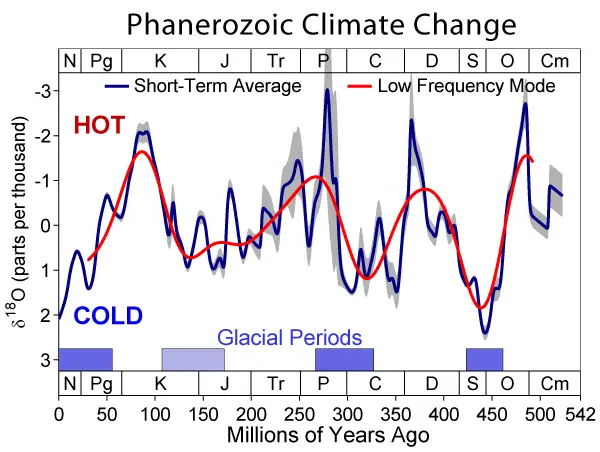
This figure shows the long-term evolution of oxygen isotope ratios during the Phanerozoic eon as measured in fossils, reported by Veizer et al. (1999), and updated online in 2004 [1]. Such ratios reflect both the local temperature at the site of deposition and global changes associated with the extent of permanent continental glaciation. As such, relative changes in oxygen isotope ratios can be interpreted as rough changes in climate. Quantitative conversion between this data and direct temperature changes is a complicated process subject to many systematic uncertainties, however it is estimated that each 1 part per thousand change in δ18O represents roughly a 1.5-2 °C change in tropical sea surface temperatures (Veizer et al. 2000).
Also shown on this figure are blue bars showing periods when geological criteria (Frakes et al. 1992) indicate cold temperatures and glaciation as reported by Veizer et al. (2000). The Jurassic-Cretaceous period, plotted as a lighter blue bar, was intrepreted as a "cool" period on geological grounds, but the configuration of continents at that time appears to have prevented the formation of large scale ice sheets.
All data presented here have been adjusted to the 2004 ICS geologic timescale [2]. The "short-term average" was constructed by applying a σ = 3 Myr Gaussian weighted moving average to the original 16,692 reported measurements. The gray bar is the associated 95% statistical uncertainty in the moving average. The "low frequency mode" is determined by applied a band-pass filter to the short-term averages in order to select fluctuations on timescales of 60 Myr or greater.
On geologic time scales, the largest shift in oxygen isotope ratios is due to the slow radiogenic evolution of the mantle. A variety of proposals exist for dealing with this, and are subject to a variety of systematic biases, but the most common approach is simply to suppress long-term trends in the record. This approach was applied in this case by subtracting a quadratic polynomial fit to the short-term averages. As a result, it is not possible to draw any conclusion about very long-term (>200 Myr) changes in temperatures from this data alone. However, it is usually believed that temperatures during the present cold period and during the Cretaceous thermal maximum are not greatly different from cold and hot periods during most of the rest the Phanerozoic. Some recent work has disputed this (Royer et al. 2004) suggesting instead that the highs and lows in the early part of the Phanerozoic were both significantly warmer than their recent counterparts.
Common symbols for geologic periods are plotted at the top and bottom of the figure for reference.
Long-term evolution
The long-term changes in isotope ratios have been interpreted as a ~140 Myr quasi-periodicity in global climate (Veizer et al. 2000) and some authors (Shaviv and Veizer 2003) have interpreted this periodicity as being driven by the solar system's motions about the galaxy. Encounters with galactic spiral arms can plausibly lead to a factor of 3 increase in cosmic ray flux. Since cosmic rays are the primary source of ionization in the troposphere, these events can plausibly impact global climate. A major limitation of this theory is that existing measurements can only poorly constrain the timing of encounters with the spiral arms.
The more traditional view is that long-term changes in global climate are controlled by geologic forces, and in particular, changes in the configuration of continents as a result of plate tectonics.
Copyright
This figure was originally prepared by Robert A. Rohde from publicly available data and is incorporated into the Global Warming Art project.
Image from Global Warming Art This image is an original work created for Global Warming Art.
Permission is granted to copy, distribute and/or modify this image under either:
The GNU Free Documentation License Version 1.2; with no Invariant Sections, Front-Cover Texts, or Back-Cover Texts. The Creative Commons Attribution-NonCommercial-ShareAlike License Version 2.5
Please refer to the image description page on Global Warming Art for more information
http://www.globalwarmingart.com/wiki/Image:Phanerozoic_Climate_Change.png
ReferencesISBN links support NWE through referral fees
- Frakes, L. A., Francis, J. E. & Syktus, J. I. (1992) Climate Modes of the Phanerozoic (Cambridge, UK : Cambridge University Press).
- Veizer, J., Ala, D., Azmy, K., Bruckschen, P., Buhl, D., Bruhn, F., Carden, G.A.F., Diener, A., Ebneth, S., Godderis, Y., Jasper, T., Korte, C., Pawellek, F., Podlaha, O. and Strauss, H. (1999) 87Sr/86Sr, d13C and d18O evolution of Phanerozoic seawater. Chemical Geology 161, 59-88.
- Veizer, J., Godderis, Y. and Francois, L.M. (2000) Evidence for decoupling of atmospheric CO2 and global climate during the Phanerozoic eon. Nature 408, 698-701.
- Shaviv, N. and Veizer, J. (2003) Celestial driver of Phanerozoic climate? GSA Today July 2003, volume 13, number 7, pages 4-10. <http://www.gsajournals.org/gsaonline/?request=get-document&issn=1052-5173&volume=013&issue=07&page=0004>
- Royer, Dana L. and Robert A. Berner, Isabel P. Montañez, Neil J. Tabor, David J. Beerling (2004) CO2 as a primary driver of Phanerozoic climate GSA Today July 2004, volume 14, number 3, pages 4-10. <http://www.gsajournals.org/gsaonline/?request=get-document&issn=1052-5173&volume=014&issue=03&page=0004>
Notes
- The statistical errors, plotted in gray, may be significantly smaller than the systematic biases that can occur. Such systematic concerns include:
- Different fossil types, spanning different phyla, are measured in different parts of the record, and biological differences in how oxygen is incorporated into different fossils may introduce biases.
- Because oxygen isotopes reflect both local temperatures and global glaciation, it is necessary to sample from large spatial areas to provide adequate global coverage. Such extensive coverage may not be available in all time periods (particularly older periods).
- In constructing the "low frequency mode", the filter was applied to the short-term averages rather than to the data directly because applying such a filter to the data directly strongly biases the results towards the value at times that have been heavily sampled.
File history
Click on a date/time to view the file as it appeared at that time.
| Date/Time | Thumbnail | Dimensions | User | Comment | |
|---|---|---|---|---|---|
| current | 14:31, 6 May 2006 | | 600 × 452 (31 KB) | Rick Swarts (talk | contribs) | [http://en.wikipedia.org/wiki/Image:Phanerozoic_Climate_Change.png source and rights] |
You cannot overwrite this file.
File usage
The following 3 pages use this file: