File: Phanerozoic Carbon Dioxide.png
Phanerozoic_Carbon_Dioxide.png (584 × 407 pixels, file size: 31 KB, MIME type: image/png)
Description
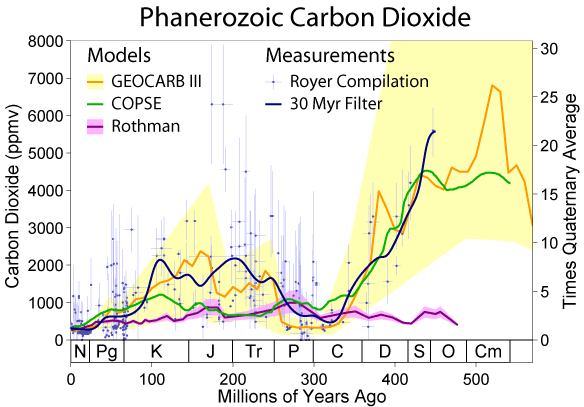
This figures shows estimates of the changes in carbon dioxide concentrations during the Phanerozoic. Three estimates are based on geochemical modeling: GEOCARB III (Berner and Kothavala 2001), COPSE (Bergmann et al. 2004) and Rothman (2001). These are compared to the carbon dioxide measurement database of Royer et al. (2004) and a 30 Myr filtered average of those data. Error envelopes are shown when they were available. The right hand scale shows the ratio of these measurements to the estimated average for the last several million years (the Quaternary). Customary labels for the periods of geologic time appear at the bottom.
Direct determination of past carbon dioxide levels relies primarily on the interpretation of carbon isotopic ratios in fossilized soils (paleosols) or the shells of phytoplankton and through interpretation of stomatal density in fossil plants. Each of these is subject to substantial systematic uncertainty.
Estimates of carbon dioxide changes through geochemical modeling instead rely on quantifying the geological sources and sinks for carbon dioxide over long time scales particularly: volcanic inputs, erosion and carbonate deposition. As such, these models are largely independent of direct measurements of carbon dioxide.
Both measurements and models show considerable uncertainty and variation; however, all point to carbon dioxide levels in the past that have been signifcantly higher than they are at present.
Copyright
This figure was prepared by Robert A. Rohde from published data and is incorporated into the Global Warming Art project.
Image from Global Warming Art This image is an original work created for Global Warming Art.
Permission is granted to copy, distribute and/or modify this image under either:
The GNU Free Documentation License Version 1.2; with no Invariant Sections, Front-Cover Texts, or Back-Cover Texts. The Creative Commons Attribution-NonCommercial-ShareAlike License Version 2.5
Please refer to the image description page on Global Warming Art for more information
http://www.globalwarmingart.com/wiki/Image:Phanerozoic_Carbon_Dioxide.png
ReferencesISBN links support NWE through referral fees
- Bergman, Noam M., Timothy M. Lenton, and Andrew J. Watson (2004). COPSE: A new model of biogeochemical cycling over Phanerozoic time. American Journal of Science 301: 182-204.
- Berner, RA and Z. Kothavala (2001). GEOCARB III: A revised model of atmospheric CO2 over Phanerozoic time. American Journal of Science 304: 397–437.
- Gradstein, FM and JG Ogg (1996). A Phanerozoic time scale. Episodes 19: 3-5.
- Gradstein, FM, JG Ogg and AG Smith (2005). A geologic time scale 2004. Cambridge University Press. ISBN 0521786738.
- Rothman, Daniel H. (2001). Atmospheric carbon dioxide levels for the last 500 million years. Proceedings of the National Academy of Sciences 99 (7): 4167-4171.
- Royer, Dana L., Robert A. Berner, Isabel P. Montañez, Neil J. Tabor, and David J. Beerling (2004). CO2 as a primary driver of Phanerozoic climate. GSA Today 14 (3): 4-10. Digital object identifier (DOI): <4:CAAPDO>2.0.CO;2 10.1130/1052-5173(2004)014<4:CAAPDO>2.0.CO;2
Notes
- All data except GEOCARB III appear on the 2004 geologic time scale (Gradstein et al. 2005). GEOCARB III appears on the Gradstein & Ogg (1996) time scale.
- All models are reported in terms of the ratio of past CO2 concentrations to "present" CO2 concentrations, where "present" represents some average value for the last few million years. To compare to direct measurements a value of 260 ppmv is chosen for the recent period, with an uncertainty of 10-15%.
- No models are capable of resolving changes faster than ~10 Myr.
- Measurements based on the interpretation of paleosols sometimes result in apparent CO2 concentrations < 0 ppmv. These were set to 0 ppmv.
- Different measurements in the Royer et al. compilation come from different authors and involve different techniques. As such the error bars are not necessary comparable. For example, some sources may have included only statistical measurement error, whereas others may have included statistical and systematic errors. Other measurements report no uncertainty at all. Because of these factors, the error measurements were ignored when determining the 30 Myr measurement average.
File history
Click on a date/time to view the file as it appeared at that time.
| Date/Time | Thumbnail | Dimensions | User | Comment | |
|---|---|---|---|---|---|
| current | 14:31, 6 May 2006 | | 584 × 407 (31 KB) | Rick Swarts (talk | contribs) | [http://en.wikipedia.org/wiki/Image:Phanerozoic_Carbon_Dioxide.png source and rights] |
You cannot overwrite this file.
File usage
The following 2 pages use this file: